The Positives and Pitfalls of Python

Hi HIST 396,


This is my first time trying Python, despite knowing about it for years beforehand. To be transparent, I did not believe I would need to learn how to code, and even further in this vein, need to apply it into my degree in history. After the constant surprises this class has thrown at me with the technical realm of digital history and the digital humanities, learning to code Python did not feel to be a large jump. These are my experiences with the two classes exploring coding through the Python language; my likes, dislikes, and considerably frequent difficulties.

Python is a high level programming language that is used across many curricular competencies for a variety of reasons and uses, such as machine learning, statistical, scientific, and mathematical computing. Python is used to power some of the most complex and popular web bases and applications in the world. Even though it is a language used by people completing complex code systems, its readability is well suited for beginners, which I did not believe until experiencing it myself in the first few lessons. Upon completing the first few lessons, I realized that there is quite a few code-academy and HTML similarities that kept popping up, such as bracketing and text language. The first few lessons were easy to follow, and it felt quite off-putting that I was able to comprehend a lot of the Python foundations, considering my poor navigation of the internet. Something that aligns with HGIS and ArcMap from our previous week is a similar structured user community that is active in answering any question one may have.

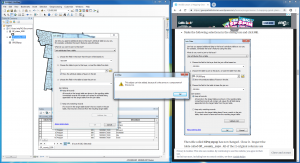
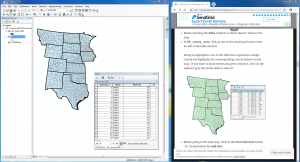
I did encounter things I did not like in the two programming labs spent on Python; not to the point of considering them pitfalls, as they are probably not a fault of the programming language, but of my general inability to use it properly and cohesively. At first I did not understand the difference between the two different windows, and thought I had to be typing in both simultaneously, until being told that one window was for writing code and the other was for the code after it has been told to run the data. Another difficulty was forgetting to type “print” each time or else nothing was going to show up on the post-run window. Opening files from the internet was another interesting task that I had to re-do a couple times, as I did not fully understand why it wanted me to integrate different code. Once getting used to the language and the (thankfully) simple readability, I was able to move quicker through the next lessons. Sadly I only had about enough time to work through the beginning and moderate difficulty lessons and did not attempt any further past that.

A few things I have learned about Python after giving it a couple attempts:

  • Python is perfect for an all-around technology rookie such as myself. I was grateful that there were easy to follow instructions, and that the lessons moved fairly slowly with much attention to the detailing of not just WHAT I was doing, but more importantly WHY I was doing it.
  • Python can be found everywhere and it is a really useful tool to learn about! The way of the future is through these scripted syntax structures, and one must not disregard them as unimportant (as I did before my attempts using it, sorry again).
  • If you do not understand basic code language, make sure that you attempt the first few lessons many times, as everything builds on one another in a cohesive way.

As for the last part of this blog, I will relate Python to what we have been talking about in class for the last few months:

Is this a valuable approach for historians?

As skeptical as I am about diving deeper into the technology that powers our world today – I realize that we are turning away from learning that does not involve web access and knowledge of the tools and applications that further its advancement in the field. To disregard a field of study as something unattached or unimportant to traditional historical processes of learning is the wrong action to take. Moving forward with history is moving forward with how we study it as well. Digital history and the digital humanities have certain pitfalls, but it is the general direction that all fields continue to be moving towards. Python, more than anything else about its code and capabilities, is a language. Language unities many avenues of culture and civilization, but it can also unite fields of study. I have been thinking of Python not as a barrier that I cannot get through from a lack of knowledge, but instead an opportunity to further historical approaches and discourse, and that is a change for the better.


That is all for now,

Meagan Laurel Power


Thoughts on HGIS

Hi History 396,


The last few weeks we have been working through the tool ArcMap, which is the primary application used in ArcGIS. GIS, as I have come to learn throughout the last few lectures and lab sessions, stands for Geographic Information Systems, and it can compile and sort data by referencing its location – in the absolute simplest of terms. The use for ArcGIS expands further in this vein, as it can manage, create, share, and analyze data spatially through a set of certain components such as mobile and desktop applications and development tools. The use of this application can be quite broad depending on the field of study one is using the platform for, but for the most part it connects spatial data and the visual engagement of maps to create its work.

As a class, we have been using ArcMap in the version 10.5, which is supported through the ArcGIS folder that is already downloaded into the computer lab computers. I have now done three different classes on HGIS; two in our weekly lab sessions, and one on my own time in the HGIS lab situated in Kirk Hall. For the rest of this blog post I will be detailing my experiences with the platform – the trials, the many errors, and ultimately what I have learned and can take away from my first experience of digital mapping.

The Geospatial Historian website is where we were told to find our lessons about HGIS mapping, and it contained five lessons developed for classroom teaching by Dr. Geoff Cunfer. These five lessons go through the basic usage of tools in ArcMap; with providing data that has already been impeded in the lesson plans themselves.

Lesson 1, Mapping Great Plains Population, has two goals: to learn the basic methods and concepts of GIS through opening and closing data sets and joining data together to the same map, and to expose students to the software, with detailing the uses of many tools on the interface. The beginning of each of these lessons involves downloading the online zip file that contains all the data necessary in completing the lesson. Throughout the first and half of the second lab session, I did not know what it meant to zip and unzip a file – to which I now know means it may contain more than one file within itself, and that it may be compressed. I immediately understood actions such as the “Add Data” button, and what the checking and unchecking of layers did to alter the image of the map. One of the more unfathomable aspects of this tool was the surplus of information that is given in the data tables. I was only provided with the GISJOIN column in this first lesson, and was left to wonder on what all of the other weirdly named columns meant in the overall manipulation of the map layers. I did run into an issue during joining GP_county_1930 and GP_states_1930 together, as the system did not allow me to choose GP1930pop as a layer:

I did not come across this issue during my first time trying Lesson 1, but during the second time when my aim was only to take progress pictures of my lessons. As for what I found most interesting in the first lesson, which relayed to what I find interesting about ArcMap in general, is the relationship created between visuals and data. It is quite incredible to see data tables such as GP_states_1930 and GP_county_1930 become interactive maps that visualize information and are able to place it into a viewable sphere for public knowledge and interpretation.

In Lesson 2, Mapping Great Plains Agriculture, there are once again, two goals the lesson wants student to meet. First, this lesson sets out to reinforce the basic GIS methods that were introduced in Lesson 1, and  second, to apply them toward irrigation farming. The final result should be highlighting where the Ogallala Aquifer is placed underneath the Great Plains.

One very small, but dumb, issue that I ran into with the Ogallala layer was somehow setting the line width wrong. While it was in the proper Hollow setting, I had somehow thinned the line far below “0.50” and it was practically invisible. I deleted the layer and retried a few times until I noticed that it was the line width that kept messing me up. It was an easy fix and a good lesson about double-checking the little things in settings boxes.

I had forgotten to take pictures of the Lesson 3: Geo-referencing Maps, but the lesson did come with two errors during my time completing it. I accidentally opened the wrong file when the instructions told me to “Add Data,” adding ErosionMap1954b.tif instead of ErosionMap1954a.tif. Everything made perfect sense once I was notified I had been geo-referencing an entirely wrong map. This was an easy fix. I may have not been reading the instructions clear enough (this can be said from my first mistake as well), for when I began geo-referencing the four points on the map to justify it to the proper size; instead of clicking on the unreferenced image first, I clicked on the referenced states layer first. I continued to do this multiple times to have my unreferenced image become displaced in different areas across the map. It got muddy, there was lots of unnecessary zooming in and out to locate the either too-large or too-small map. Upon asking for help, and reading a little closer, I came to understand that there is an order to which one must be clicked on first. After these two issues were resolved, the rest of the geo-referencing went smoothly, with the final result being quite close to the margin or error in the instructions. One downfall of this lesson, to me, is the bleak acceptance that my work will never be exact with using the map I was provided with. Accepting error is something I must become normalized with if I choose to continue with ArcMap and HGIS.

Each of the lesson-specific errors I had are listed throughout this blog post, but there is one difficulty I had come across throughout each of the lessons on ArcMap. Since this tool works best with the data tables open for the entire time one is placing layers of data on a map, I found it to be an issue of not having enough screen space to fit the tables that were necessary to understanding the translation from data to the visuality of mapped data.

I was not able to zoom in to see the intricacies of the map, whilst still being able to see the instructions and see the data table on more than an unhelpful 3×3 cell frame. This is where having two screens to fit the instructions (or just the data table if one knows how to use the program) would be helpful in having a closer view of the county’s within each state and the information pertaining to them.

My overall experience with ArcMap and HGIS in general has been positive! I have learned that one needs to be specific in their data; making sure to enter the exact number needed, opening up the proper folder with the corresponding information, and understanding that there is a method and order to everything that must be completed. Even though I mostly included the problems I came across throughout this blog post, there are significant positives that deserve recognition. This platform allows for online communication and collaboration capabilities, since it has (from the reviews I have been reading) an exceptionally large user base that is always available when needing help. ArcGIS and ArcMap democratizes previously closed-off data and brings it into a field of wider understanding among the public sphere. I think this is important when moving forward digitally, especially with open-source material changing the way information is being shared.

I may find myself downloading this software onto my own laptop once I am finished up with my degree, as I believe I will be using this platform in the near future.


Cheers,

Meagan Laurel Power


What is Omeka?

Hi 396,

I was looking through each of the tools for digital history research, and Omeka caught my eye. I enjoy looking at timeline projects as I find having that visual component can make a considerable difference when interpreting data. An example of this is our guest speaker Benjamin Hoy and his Building Borders project. When one simply looks at data without a visual component, it means almost nothing to someone not in the field. In a way, creations like Omeka have opened up a platform that academics and regular web users can both interpret. Another component that influenced me to look into Omeka is its broad platform that is used by multiple different institutions to fit a variety of purposes. My trials and comments about the online tool are below.

Omeka is a tool that was created by developers at the Roy Rosenzweig Centre for History and New Media at George Mason University in 2008. It is an open-source web publishing platform that caters to many different purposes. With Omeka’s friendly design, institutions such as museums, libraries, archives, and collections of scholarly merit use it to create galleries and exhibits that can properly showcase its array of information in a chronological or taxonomical referencing system. Since it is set up for mostly public use, Omeka’s design is quite simple to understand (and I am as stubborn and inexperienced as one can get with anything digital, so this says a lot) and offers a variety of plugins and themes that are easily customizable to suit the needs of ones project aesthetic. Omeka relies on a strong metadata standard for find-ability and search-ability, which is one of its strongest components. Metadata (to which I will admit, I had no idea about until a few weeks ago) is data that provides data about other data – which doesn’t sound confusing at all. Descriptive metadata is the most important kind in the types of cataloguing and classifying that one would want to have in a digital archival setting. When metadata is entered fully and properly, it is a wonderful asset for platforms such as Omeka.

The issue that arises with Omeka, then, is not so much the metadata and its use, but instead the way we compile and edit the metadata. I learned this (and what metadata is) when our class took a trip over to the Digitization team at the University Library. There can be sloppily done classifying, which is not the programs fault, but its user. When one uploads an image into Omeka’s database, it gives the user four different areas where they can classify the image. Starting with Dublin Core, which is the metadata element to all existing Omeka records. It allows input to the name of the given source (title), the topic of the source (subject), a visual account of the source (description), a related source from which the original source is taken from to begin with (source), the company that holds certain copyright over the source (publisher), the time in history associated with the event of the source (date), and then more in-depth areas for classification such as contributors, rights, relations, format, language, type of resource, identifier, and coverage. Item Type Metadata is the second tab, which asks what type of image is being brought into Omeka, with categories such as still image, text, website, database, hyperlink, etc. Once one of these options is clicked on, a corresponding set of tabs will open up to codify the source further. The third tab is Files, and it is where one would attach the source into a display order that is preferable for the projects intentions. Lastly there is Tags, which is the final step in systematization – attaching key words that are in relation to the source used. Once all of the data is placed into these four steps and saved, one can go into a few different tabs that organize the created project: browse items, browse collections, browse exhibits, and an about tab.

Omeka is a great tool for what I have explored of it so far. It is relatively easy to use, a useful formatting for cataloguing and classifying source materials of different media, and allows a large population of web users to understand its system without having coding experience. Since I am a very new user to this platform, it was difficult to find limitations with how it is organized, so I had to do some looking online for what others believed were the weaknesses of the tool. Besides the usual limitations most programming websites offer – only a set amount of plugins were free and many others had to be purchased on a yearly plan, there were only a few limiting factors of the program. Omeka is apparently not able to be integrated with Javascript into a coherent element.

Histories of the National Mall is the first website that I explored that uses Omeka. It offers historical maps in colour, and gives information on the mall’s history. Another interesting project I stumbled upon is called the Intemperance project. It is a digital project that details cocktail culture in New Orleans, Louisiana. This one was quite progressive in the way that it seamlessly scrolls through a detailing of the project, the map that shows prohibition from 1919 and 1933, and then a browsing section to look through the entire database. I did find quite a few websites that were outdated, but this can be the fault of the creator for not updating their projects.

That is all I have on Omeka for now.


Best,

Meagan Laurel Power

Mapping A Digital Harlem


Hi History 396,

I am still quite new to digital mapping – its idiosyncrasies, its protocol, and how the heck to move around a website, nonetheless ~comprehend~ its information. I chose to look through Digital Harlem; mostly because I am very intrigued when looking at city maps through a certain lens of time, but also because of the rich history a neighbourhood such as Harlem has.

Digital Harlem was created to showcase the “Everyday Life” (as displayed in its title) from the years 1915 to 1930. My initial thoughts on the website are varied. From other websites we have covered in class discussion, Digital Harlem is on the older side with its website design as it was designed and created in 2007 by Damian Evans, and redeveloped in 2015 by Ian Johnson and Artem Osmakov. The website looks to serve as a public history forum for those living in the fifteen year span in Harlem, and looks to get their research and data from government and church documents, map systems, possibly census work. As said in the welcome pop-up page upon entering the website, the website presents “information, drawn from legal records, newspapers, and other archival and published sources, about everyday life in the New York City’s Harlem neighbourhood in the years 1915-1930.”

There are multiple tabs that bring the viewer to interactive maps through the lens of events, places, and people. When entering the first tab talking about the project itself, the historians explained the study and website in more detail. The project was taken on by the Department of History at the University of Sydney, Australia, and four historians, Stephen Garton, Stephen Robertson, Graham White, and Shane White, led the project with the accompanying assistance of Delwyn Elizabeth, Conor Hannan, Nick Irving, Anna Lebovic, and Michael Thomson. This project proves to discuss and display a different project than what most historians would study in Harlem – instead of focusing on black artists and the black middle class, these historians turned their lens inward to the lives of ordinary African New Yorkers. Upon clicking into the tab to find out more about the project itself, I was redirected to a WordPress blog that details not only its publications, but also every presentation ever given on the project, to which there are many. The material covered is very easily accessible and contains no ambiguity to its research aims – something that I find many websites do poorly. With this being said, the lens at which this study is through is very specific and narrow scoped, so it would be very problematic if they were not able to organize or explain their project.

When looking through the Places setting, it interested me to find that there are ten nursery homes listed in the area between the parameters of 1915-1930, and only one landmark of the remaining places polled, such as public library, beauty salon, and confectionary store. When thinking about the period of history in question, it does make sense why there are many nursery homes, as this study details the regular lives of African American New Yorkers – working for most of the daytime, and either coming home in the evening or going to work at a second job. This also displays that there may have been a very large population of youth, as the amount of child care organizations greatly outweigh all other organizations in the study. Another interesting find was the amount of churches that are present in Harlem in this time. As said on the website, there was a reported 140 churches (or places of more casual worship, such as storefronts) in 150 blocks of Harlem! Places of worship, as explained through this website, were the most heavily populated places for those living in Harlem. From this information one can gather that religious affiliation and prominence in Harlem was extremely important to the everyday lifestyle.

This project also offers a look into many other facets of the everyday life in Harlem – everything from basketball games, boxing, and and gambling, to the more threatening records, riots, murders, assaults, and arrests. Looking through the collected data on all of these occurrences in fifteen years, many parallels can be drawn to explain legal changes and pressures, the distribution of wealth, and the overall topographical impact of the cityscape itself.

Overall, this website had more positive aspects than negative. Although outdated in its design, it did prove to have useful quantitative evidence with the amalgamation of research through different historical documents. Digital Harlem also provided great background information on how the projects creation and objectives. There were a few negative aspects to this project as well – mostly to do with its design. Since it is an outdated website compared to others that we reviewed in class, it made it more difficult to use the map systems, as they were quite obsolete to look at.

Digital Harlem is representative and informative about the fifteen years that it studies in depth. It provides valuable information about the daily lifestyle of African American New Yorkers that is quantitatively gathered and sympathetically written about.


Cheers,

Meagan Laurel Power


Introductions

Hey hey History 396,

My name is Meagan Power. I have been at the University of Saskatchewan for four years now and have enjoyed almost (I cannot lie, there has been some rough patches) all of my time here! I am currently pursuing two degrees: the first, which I hope to graduate with in the spring, is a B.A in History, and the second degree, a B.Ed in Secondary English and History, is one I hope to complete in Spring 2021. The ultimate end game is to go into teaching, but if this does not work out I will be going back to school to further my education in history (possibly towards a PhD in History, to be determined).

A few things about me besides school. I have lived in Saskatoon all my life and am very fortunate to only have a small drive to the University! I have a wonderful little dog named Molly, she is getting a bit older now, nine years, so the walks are a bit shorter, but she is still as cute as ever and very energetic for her age! I have worked at the same restaurant for five years now, serving and bartending; it is where I have met some of my greatest friends and what puts me through my schooling. In my spare time I like to do what most other twenty-something’s enjoy: traveling with very limited funds, reading books, exploring the city, being around friends and family, taking pictures of the things I love, etc.

While this course is going to be difficult, due to the technological aspect (the largest struggle, in my opinion) I am excited to see the knowledge it gives me in being able to better my research and understanding in the study and lens of digital history itself.


Cheers,


Meagan Laurel Power